QENTAK RESEARCH · 2026 EDITION
British Columbia: independent and home education, 2026 Edition
British Columbia has the highest independent-school share in Canada: about one student in seven.
Snapshot
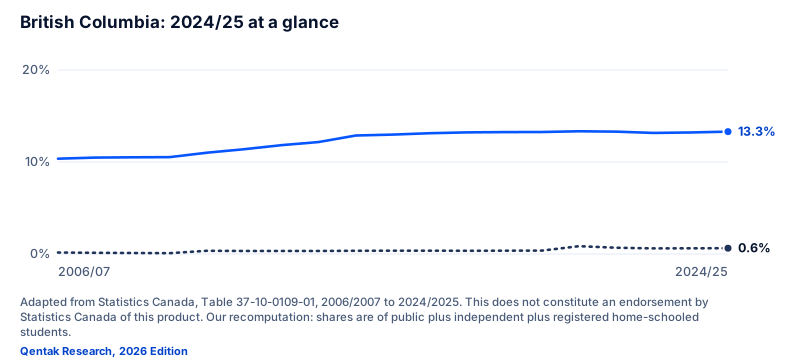
British Columbia: 2024/25 at a glance
93,891 independent students (13.3%); 4,458 registered home-educated (0.6%); funds independent schools at 35–50% of a public amount.
| School year | Independent | Independent share | Home-educated | Home-education share |
|---|---|---|---|---|
| 2006/07 | 65,367 | 10.36% | 1,038 | 0.16% |
| 2007/08 | 65,475 | 10.48% | 813 | 0.13% |
| 2008/09 | 65,076 | 10.51% | 690 | 0.11% |
| 2009/10 | 64,728 | 10.53% | 555 | 0.09% |
| 2010/11 | 70,272 | 11.01% | 2,229 | 0.35% |
| 2011/12 | 71,868 | 11.39% | 2,085 | 0.33% |
| 2012/13 | 74,310 | 11.83% | 2,061 | 0.33% |
| 2013/14 | 76,074 | 12.17% | 2,034 | 0.33% |
| 2014/15 | 80,634 | 12.88% | 2,220 | 0.35% |
| 2015/16 | 81,660 | 12.98% | 2,247 | 0.36% |
| 2016/17 | 83,469 | 13.13% | 2,316 | 0.36% |
| 2017/18 | 84,996 | 13.22% | 2,256 | 0.35% |
| 2018/19 | 86,082 | 13.25% | 2,310 | 0.36% |
| 2019/20 | 87,222 | 13.26% | 2,454 | 0.37% |
| 2020/21 | 87,291 | 13.34% | 5,547 | 0.85% |
| 2021/22 | 88,722 | 13.30% | 4,515 | 0.68% |
| 2022/23 | 89,427 | 13.16% | 4,131 | 0.61% |
| 2023/24 | 91,698 | 13.21% | 4,338 | 0.62% |
| 2024/25 | 93,891 | 13.30% | 4,458 | 0.63% |
- Independent share
- Registered home-education share
- Independent change since 2006/07+44%
- Fraser share, 2023/2413.2%
- Outside public, 2024/2513.9%
Adapted from Statistics Canada, Table 37-10-0109-01, 2006/2007 to 2024/2025. This does not constitute an endorsement by Statistics Canada of this product. Our recomputation: shares are of public plus independent plus registered home-schooled students.
Cite this chart
Adapted from Statistics Canada, Table 37-10-0109-01, 2006/2007 to 2024/2025. This does not constitute an endorsement by Statistics Canada of this product. Our recomputation: shares are of public plus independent plus registered home-schooled students. Chart: "British Columbia: 2024/25 at a glance", Qentak Research, The State of Independent & Home Education in Canada, 2026 Edition. https://qentak.com/research/canada/british-columbia#chart-province-british-columbia-snapshot
Embed as an image
<figure>
  <img src="https://qentak.com/research/charts/province-british-columbia-snapshot.svg" alt="Line chart of British Columbia's independent share (solid) and registered home-education share (dotted) of K-12 students, 2006/07 to 2024/25." width="800" style="max-width:100%;height:auto">
  <figcaption>Adapted from Statistics Canada, Table 37-10-0109-01, 2006/2007 to 2024/2025. This does not constitute an endorsement by Statistics Canada of this product. Our recomputation: shares are of public plus independent plus registered home-schooled students. Chart by <a href="https://qentak.com/research/canada/british-columbia#chart-province-british-columbia-snapshot">Qentak Research</a>.</figcaption>
</figure>
Qentak's own text and charts are free to share with attribution. Statistics Canada data is used under the Open Licence; the full chapter on data, sources and terms is on the data page.
At a glance
| Measure | Figure | Source and year |
|---|---|---|
| Independent students | 93,891 (13.3% of K-12) | Statistics Canada, 2024/25 |
| Independent share, other measures | 13.2% (Fraser, 2023/24); 13.7% (Cardus, 2026); nearly 15% with home education (Cardus, 2023) | Fraser Institute; Cardus |
| Change in headcount since 2006/07 | +44% (65,367 to 93,891) | Statistics Canada |
| Registered home-educated | 4,458 (0.6%) in 2024/25; 2,454 in 2019/20 | Statistics Canada |
| Public spending per student | $15,116 (2022/23); up 9.3% in real terms since 2013/14 | Fraser Institute, 2025 Edition |
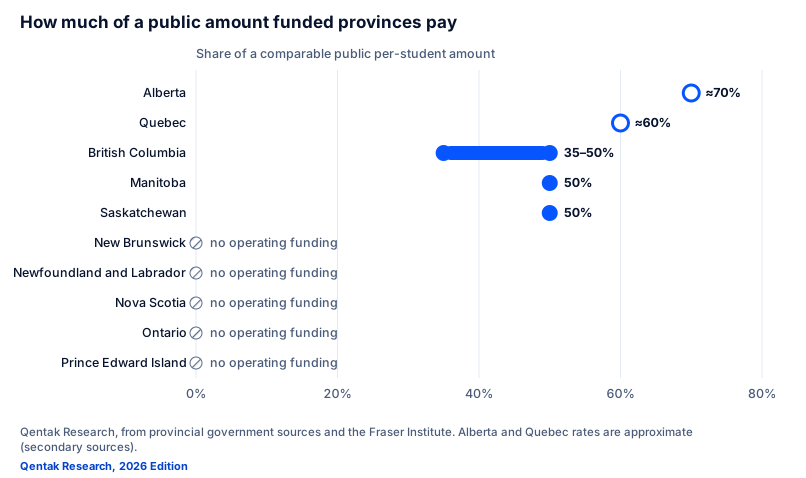
How much of a public amount funded provinces pay
Bars show ranges; hollow markers are approximate. The bases differ, so the percentages are not directly comparable.
Estimate Alberta and Quebec rates are approximate and rest on secondary sources.
| Province | Share of public amount | Status | Basis |
|---|---|---|---|
| Alberta | ≈70% | approximate | Accredited funded private/independent schools receive about 70% of public per-student funding on most grants (100% for some categories, e.g. ECS or complexity per secondary sources); new operators ineligible in year 1. |
| Quebec | ≈60% | approximate | Subsidised private schools receive about 60% of the public per-pupil amount for educational services only (no buildings or student services); one comparison cites about 50%. |
| British Columbia | 35–50% | verified | Group 1 = 50%, Group 2 = 35% of the local public school district per-student operating grant (school is placed by comparing its per-student operating cost with the district grant). Distributed learning moved to 50/35 from 2020/21. |
| Manitoba | 50% | verified | Funded independent schools: Instruction and Services grant = lesser of $6,837 per eligible pupil or the school's eligible operating cost, where the per-pupil rate is derived from 50% of the 2023/24 net operating cost per FTE public pupil (2025/26). Plus special needs L2 $9,500 / L3 $21,130, curricular materials $60, and indirect shared services (clinician, facilities, transport). |
| Saskatchewan | 50% | verified | Qualified Independent Schools: 50% of the provincial per-student average on actual eligible registered students (2022 release also described an incremental rate at 400+ students; unconfirmed). |
| New Brunswick | 0% | no funding | No operating funding for independent schools. |
| Newfoundland and Labrador | 0% | no funding | No operating funding for independent schools. |
| Nova Scotia | 0% | no funding | No operating funding for independent schools. |
| Ontario | 0% | no funding | No operating funding for independent schools. |
| Prince Edward Island | 0% | no funding | No operating funding for independent schools. |
- Verified from government text
- Approximate (secondary sources)
Confidence (TRI-17): high for BC, SK, MB; medium for AB and QC. BC 35-50 (official); SK 50 (official); MB 50 (official); QC 50-60 (secondary: Policy Alternatives, FEEP, others; FEEP says the subsidy is about 40% of total cost); AB 70 (CBC, Alberta School Councils, a blog quoting the manual; Funding Manual not read). No source for 80%
Qentak Research, from provincial government sources and the Fraser Institute. Alberta and Quebec rates are approximate (secondary sources).
Cite this chart
Qentak Research, from provincial government sources and the Fraser Institute. Alberta and Quebec rates are approximate (secondary sources). Chart: "How much of a public amount funded provinces pay", Qentak Research, The State of Independent & Home Education in Canada, 2026 Edition. https://qentak.com/research/canada/british-columbia#chart-funding-ladder
Embed as an image
<figure>
  <img src="https://qentak.com/research/charts/funding-ladder.svg" alt="A dot and range plot: British Columbia 35 to 50 percent, Saskatchewan 50, Manitoba 50, Quebec about 60 and Alberta about 70 percent of a public per-student amount; Ontario and four Atlantic provinces provide none." width="800" style="max-width:100%;height:auto">
  <figcaption>Qentak Research, from provincial government sources and the Fraser Institute. Alberta and Quebec rates are approximate (secondary sources). Chart by <a href="https://qentak.com/research/canada/british-columbia#chart-funding-ladder">Qentak Research</a>.</figcaption>
</figure>
Qentak's own text and charts are free to share with attribution. Statistics Canada data is used under the Open Licence; the full chapter on data, sources and terms is on the data page.
Independent schools and funding
BC's share has been stable at 13% for the last several years after climbing from about 10% in 2006/07. The funding model is graded: eligible independent schools receive 50% (Group 1) or 35% (Group 2) of the local public school district's per-student operating grant, depending on how the school's per-student operating cost compares with the district's. Independent distributed-learning schools are funded at 50% or 35% of the public DL rate. The Ministry's page was updated July 28, 2026, and a preliminary 2026/27 rates document exists.
Fraser has described the BC independent share as "almost one in eight"; Cardus's figure of 13.7% and the inclusion of home education push it toward one in seven. Either way it is the highest in the country, and the funding model is a plausible but untested reason.
Home education
- Registration: parents register a home-educated child with a public school or a participating independent school (a "registered homeschooler"), generally by September 30, in the years of compulsory attendance (from the year a child turns 6, to age 16). We have not read the School Act provisions (sections 12 to 14) in full, so check the Ministry's page for current detail.
- Reporting: unclear in the sources we read; some describe no required reporting, others school-based assessment services. We do not state a rule.
- Funding: the province pays the registering school $250 for each registered home-schooled child (public school) or $175 (independent school with a Group 1 or 2 classification). The family does not receive a payment. Enrolment in a distributed-learning program is a separate, funded pathway.
- Numbers: registered home education was 2,454 in 2019/20, 5,547 in 2020/21 and 4,458 in 2024/25. The provincial series has a break in 2009/10, so long-run comparisons across it are unreliable. Fraser's 2022 edition found BC the one province where home education had not grown over its window; the current series shows growth since 2019/20.
School year
The legal school year runs July 1 to June 30. Minimum instructional hours are 853 (Kindergarten), 878 (Grades 1 to 7) and 952 (Grades 8 to 12). Calendars are set under the School Calendar Regulation; check each district or school for 2026/27 dates.
Privacy context
BC public bodies are covered by FOIPPA, which requires breach notification (section 36.3).
Sources: Statistics Canada, Table 37-10-0109-01; Fraser Institute 2026 Edition and 2025 spending edition; Cardus, Better Together (2026) and Charting New Horizons (2023); Province of British Columbia, independent school funding page (updated 2026-07-28), funding rates 2025/26, and homeschooling page. Not legal advice.