QENTAK RESEARCH · 2026 EDITION, FIRST ANNUAL REPORT
The State of Independent & Home Education in Canada
Where Canadian children are educated, how that is changing, what it costs and who pays, with every estimate labelled as an estimate.
PDF checksum (SHA-256): ed00cf4cb50f52f9bf9cc214f0a47bd5d010033033bc74e9552b54d8e04b3bf8
Introduction · 1 min
A note before we begin
Key takeaways
- Where sources differ, the report shows the range and explains why.
- Every estimate is labelled as an estimate, not a count.
If you are a parent who has ever lain awake at 2 a.m. wondering whether you are allowed to do this (teach your own child, choose a different school, ask for something better than the default), this report is for you.
If you are a principal watching your enrolment climb while your software bill climbs faster, this report is also for you.
And if you work in a ministry, a division office or a school board and you have sensed, without quite being able to prove it, that something fundamental is shifting in Canadian education: we did the homework, and the numbers are below.
We have tried to be careful about one thing above all. Education statistics in Canada come from several publishers who count slightly different things in slightly different years. Where they differ, we show the range and explain why, rather than choosing the number that sounds best. Where a figure is an estimate and not a count, we say so.
Let's talk numbers like adults, and then let's talk about what they mean.
Chapter 1 · 2 min
The Headline: Nearly One in Twelve Canadian Students Now Learns in an Independent School
Key takeaways
- The independent share of K-12 enrolment rose 45%, from 5.9% to 8.5% (2000/01 to 2023/24): a change in share, not only in headcount.
- Statistics Canada puts private and independent schools at 8.0% in 2024/25, a record. Nearly one student in twelve.
- With registered home education, about 9.5% of students learn outside government-run schools.
Here is the most important sentence in this report.
Between 2000/01 and 2023/24, the independent-school share of Canadian K-12 enrolment rose 45%, from 5.9% to 8.5%. Over the same period the public-school share fell from 93.8% to 90.4% (a 3.7% relative decline), even though public headcount edged up 0.6%. (Fraser Institute, Where Our Students Are Educated, 2026 Edition.)
The five numbers to remember
- 8.0% to 8.5%of K-12 students attend an independent schoolStatistics Canada 8.0% (2024/25); Fraser Institute 8.5% (2023/24). Nearly one in twelve.
- +45%rise in the independent share since 2000/01From 5.9% to 8.5% (Fraser, 2023/24). A change in share; headcount rose 51%.
- 9.5%learn outside government-run schoolsIndependent plus registered home education, 2024/25, our recomputation of Statistics Canada data.
- 66,228registered home-educated studentsStatistics Canada, 2024/25. More than tripled (+264%) from 2006/07 to 2021/22.
- 80,000 to 100,000estimated children educated at homeAn estimate, not a count: no agency publishes one. Confidence: low (estimate).Estimate
| Figure | What it measures | Type | Basis |
|---|---|---|---|
| 8.0% to 8.5% | of K-12 students attend an independent school | share | Statistics Canada 8.0% (2024/25); Fraser Institute 8.5% (2023/24). Nearly one in twelve. |
| +45% | rise in the independent share since 2000/01 | share change | From 5.9% to 8.5% (Fraser, 2023/24). A change in share; headcount rose 51%. |
| 9.5% | learn outside government-run schools | share | Independent plus registered home education, 2024/25, our recomputation of Statistics Canada data. |
| 66,228 | registered home-educated students | count | Statistics Canada, 2024/25. More than tripled (+264%) from 2006/07 to 2021/22. |
| 80,000 to 100,000 | estimated children educated at home | estimate | An estimate, not a count: no agency publishes one. Confidence: low (estimate). |
Adapted from Statistics Canada, Table 37-10-0109-01, 2006/2007 to 2024/2025. This does not constitute an endorsement by Statistics Canada of this product. Fraser Institute figures are cited, not reproduced.
Cite this chart
Adapted from Statistics Canada, Table 37-10-0109-01, 2006/2007 to 2024/2025. This does not constitute an endorsement by Statistics Canada of this product. Fraser Institute figures are cited, not reproduced. Chart: "The five numbers to remember", Qentak Research, The State of Independent & Home Education in Canada, 2026 Edition. https://qentak.com/research/state-of-independent-and-home-education-canada-2026#chart-stat-cards
Qentak's own text and charts are free to share with attribution. Statistics Canada data is used under the Open Licence; the full chapter on data, sources and terms is on the data page.
Read that carefully, because it is easy to misstate. Independent enrolment grew about 51% in headcount (318,947 to 482,939 students). Public enrolment did not shrink; it was roughly flat while independent and home education grew faster. The 45% and the 3.7% are changes in share. That is what makes this a shift and not a rounding error: total enrolment rose only 4.5% over 23 years, and almost all of the movement was between sectors.
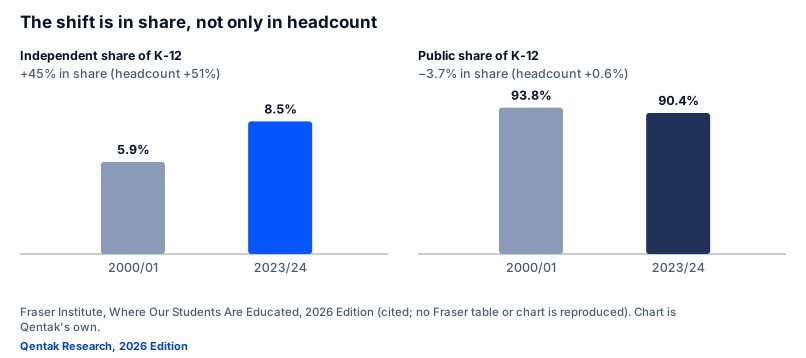
Statistics Canada, which counts on its own definitions, reaches the same place. Its latest release puts the private and independent share of students at 8.0% in 2024/25, a new high and the fourth consecutive rise. Fraser's 8.5% (2023/24) and Statistics Canada's 8.0% (2024/25) are two measures of one fact: nearly one student in twelve is in an independent school. Add the students whom provinces register as home-educated and, on our recomputation of Statistics Canada's open data, about 9.5% of students (2024/25) learn outside the government-run system. Cardus, allowing for under-reported home education, has suggested the true figure could be as high as 11% to 12%. That is an estimate, and we label it as one.
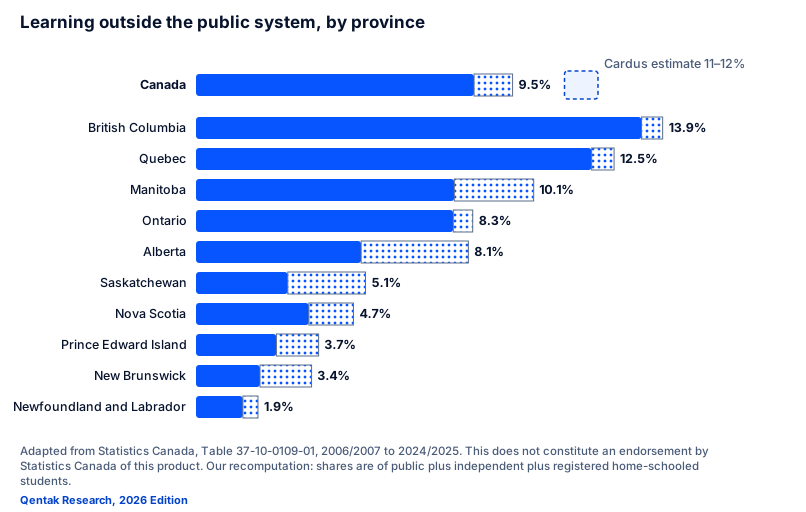
British Columbia stands out. About 13.2% to 13.7% of BC students (roughly one in seven) attend an independent school (Fraser, 2023/24; Cardus, 2026), and Cardus puts the figure near 15% when home education is included.
Nor is this a pandemic blip. An earlier Fraser edition headlined that the independent share was increasing in every province. In the most recent years some of the smallest systems (Newfoundland and Labrador, Prince Edward Island) have slipped back a little, so "every province, every year" would overstate it. The national trend is clear all the same: independent headcount has dipped only three times since 2006/07 (2009/10, 2011/12 and the pandemic year of 2020/21), each time by less than 2%, and the share reached a new high in 2024/25.
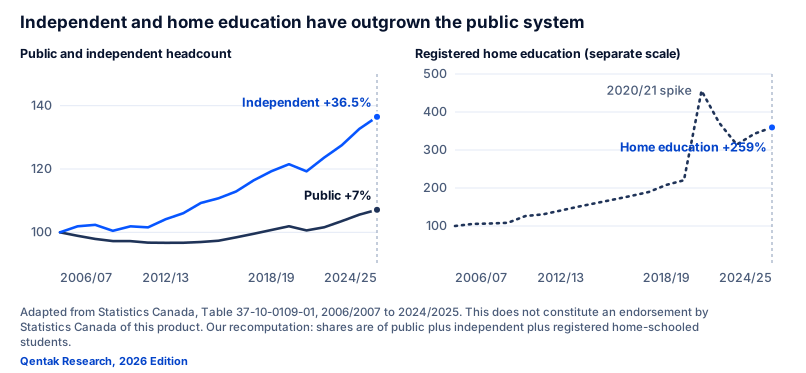
Independent and home education have outgrown the public system
Registered headcount, index 2006/07 = 100, Canada. Home education is on its own scale.
| School year | Public index | Independent index | Home education index | Independent students | Home-educated students |
|---|---|---|---|---|---|
| 2006/07 | 100.0 | 100.0 | 100 | 351,408 | 18,426 |
| 2007/08 | 98.9 | 101.9 | 105 | 358,101 | 19,422 |
| 2008/09 | 97.9 | 102.4 | 107 | 359,718 | 19,638 |
| 2009/10 | 97.2 | 100.5 | 108 | 353,097 | 19,983 |
| 2010/11 | 97.2 | 101.9 | 126 | 358,068 | 23,262 |
| 2011/12 | 96.7 | 101.6 | 131 | 356,928 | 24,078 |
| 2012/13 | 96.7 | 104.1 | 141 | 365,967 | 25,920 |
| 2013/14 | 96.7 | 106.0 | 151 | 372,636 | 27,804 |
| 2014/15 | 96.9 | 109.3 | 160 | 384,021 | 29,520 |
| 2015/16 | 97.4 | 110.8 | 170 | 389,187 | 31,245 |
| 2016/17 | 98.4 | 112.9 | 179 | 396,762 | 33,006 |
| 2017/18 | 99.5 | 116.4 | 189 | 409,146 | 34,911 |
| 2018/19 | 100.7 | 119.3 | 208 | 419,175 | 38,346 |
| 2019/20 | 101.9 | 121.5 | 220 | 427,023 | 40,608 |
| 2020/21 | 100.6 | 119.3 | 456 | 419,079 | 83,988 |
| 2021/22 | 101.6 | 123.6 | 372 | 434,346 | 68,466 |
| 2022/23 | 103.5 | 127.5 | 314 | 448,071 | 57,894 |
| 2023/24 | 105.6 | 132.7 | 343 | 466,257 | 63,150 |
| 2024/25 | 107.1 | 136.5 | 359 | 479,571 | 66,228 |
2024/25: public 107.1, independent 136.5, registered home education 359 (2006/07 = 100).
Adapted from Statistics Canada, Table 37-10-0109-01, 2006/2007 to 2024/2025. This does not constitute an endorsement by Statistics Canada of this product. Our recomputation: shares are of public plus independent plus registered home-schooled students.
Cite this chart
Adapted from Statistics Canada, Table 37-10-0109-01, 2006/2007 to 2024/2025. This does not constitute an endorsement by Statistics Canada of this product. Our recomputation: shares are of public plus independent plus registered home-schooled students. Chart: "Independent and home education have outgrown the public system", Qentak Research, The State of Independent & Home Education in Canada, 2026 Edition. https://qentak.com/research/state-of-independent-and-home-education-canada-2026#chart-independent-vs-public-index
Embed as an image
<figure>
  <img src="https://qentak.com/research/charts/independent-vs-public-index.svg" alt="Two line charts of indexed headcount, 2006/07 to 2024/25. Public enrolment rose about 7%, independent about 36.5%; registered home education roughly tripled after peaking above 450 in 2020/21." width="800" style="max-width:100%;height:auto">
  <figcaption>Adapted from Statistics Canada, Table 37-10-0109-01, 2006/2007 to 2024/2025. This does not constitute an endorsement by Statistics Canada of this product. Our recomputation: shares are of public plus independent plus registered home-schooled students. Chart by <a href="https://qentak.com/research/state-of-independent-and-home-education-canada-2026#chart-independent-vs-public-index">Qentak Research</a>.</figcaption>
</figure>
Qentak's own text and charts are free to share with attribution. Statistics Canada data is used under the Open Licence; the full chapter on data, sources and terms is on the data page.
Nearly 483,000 students attend independent schools. Each of those is a decision made at a kitchen table: a parent holding a registration form, deciding with their own money what their child's education should look like. When we use the word "choice" in this report we do not mean politics. We mean that decision, repeated nearly half a million times, and the direction it points.
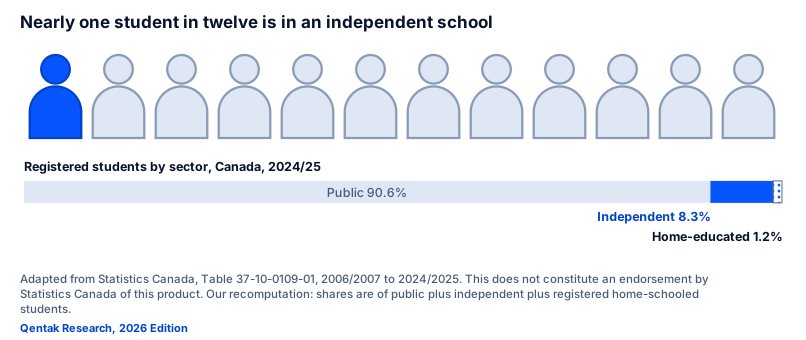
Nearly one student in twelve is in an independent school
Twelve students; one highlighted. Statistics Canada counts 8.0% (2024/25), the Fraser Institute 8.5% (2023/24).
| Sector | Students, 2024/25 | Share |
|---|---|---|
| Public | 5,229,759 | 90.55% |
| Independent | 479,571 | 8.30% |
| Registered home education | 66,228 | 1.15% |
Adapted from Statistics Canada, Table 37-10-0109-01, 2006/2007 to 2024/2025. This does not constitute an endorsement by Statistics Canada of this product. Our recomputation: shares are of public plus independent plus registered home-schooled students.
Cite this chart
Adapted from Statistics Canada, Table 37-10-0109-01, 2006/2007 to 2024/2025. This does not constitute an endorsement by Statistics Canada of this product. Our recomputation: shares are of public plus independent plus registered home-schooled students. Chart: "Nearly one student in twelve is in an independent school", Qentak Research, The State of Independent & Home Education in Canada, 2026 Edition. https://qentak.com/research/state-of-independent-and-home-education-canada-2026#chart-one-in-twelve
Embed as an image
<figure>
  <img src="https://qentak.com/research/charts/one-in-twelve.svg" alt="Twelve student figures with one highlighted, below a bar showing public 90.6%, independent 8.3% and home-educated 1.2% of registered students in 2024/25." width="800" style="max-width:100%;height:auto">
  <figcaption>Adapted from Statistics Canada, Table 37-10-0109-01, 2006/2007 to 2024/2025. This does not constitute an endorsement by Statistics Canada of this product. Our recomputation: shares are of public plus independent plus registered home-schooled students. Chart by <a href="https://qentak.com/research/state-of-independent-and-home-education-canada-2026#chart-one-in-twelve">Qentak Research</a>.</figcaption>
</figure>
Qentak's own text and charts are free to share with attribution. Statistics Canada data is used under the Open Licence; the full chapter on data, sources and terms is on the data page.
The five numbers to remember
| # | Finding | Figure |
|---|---|---|
| 1 | Independent-school share of K-12 enrolment, 2000/01 to 2023/24 | 5.9% to 8.5% (+45%); headcount +51% |
| 2 | Public-school share over the same period | 93.8% to 90.4% (-3.7%); public headcount +0.6% |
| 3 | Registered home-education enrolment, 2006/07 to 2021/22 | More than tripled (+264%); 66,228 in 2024/25 |
| 4 | Students in independent schools, latest | 8.0% to 8.5% of K-12 (nearly 1 in 12); about 9.5% with registered home education |
| 5 | Children educated at home | 66,000 reported (2024/25); actual practice estimated at roughly 80,000 to 100,000 |
Row 5 is an estimate, not a count. See Section 3 for the basis.
Chapter 2 · 3 min
The Independent School Story: Quiet, Massive, Misunderstood
Key takeaways
- The independent sector is mostly small and community-rooted, not the stereotype.
- Ontario has the most independent students (175,350); British Columbia has the highest share (13.3%).
- Where sources differ, as in Alberta (4.9% or 6.7%), the cause is definition, not disagreement.
Let's kill a stereotype before it gets in the way.
When most Canadians hear "private school," they picture a granite building with a waitlist and a $40,000 cheque. That school exists. It is also almost entirely irrelevant to the real story.
The most thorough national portrait is still the one by Deani Van Pelt and Derek Allison for the Fraser Institute, A Diverse Landscape: Independent Schools in Canada (2016, data for 2013/14). It counted 1,935 independent schools serving 368,717 students, about 6.8% of enrolment at the time (about one in fifteen), and concluded that rigid typecasting of independent schools "is more myth than reality." Its findings: only 4.7% of schools fit the elite preparatory profile; 65% of schools enrolled fewer than 150 students; at least 60.6% received no government funding; and religious schools enrolled about half of independent students (178,119 of 368,717), led by non-Catholic Christian, Catholic, Jewish and Islamic schools, while 581 specialty schools (Montessori, Waldorf, classical, arts and others) made up another 30% of schools. Cardus's 2022 profile of Ontario found the same texture there, and its 2023 paper cites it: 39% of Ontario's independent schools religious and 41% built around a special emphasis.
That was 2013/14. The sector has grown since. Statistics Canada counts about 480,000 independent students in 2024/25 (Fraser: nearly 483,000 in 2023/24; Cardus: over 470,000), now nearly one in twelve. Ontario alone has gone from roughly 950 independent schools in 2013/14 to more than 1,670 today (Cardus), so the national school count is well above the 2013/14 figure. We know of no consolidated, current national count of schools, and we will not invent one; see Section 7.
Provincial picture, 2024/25
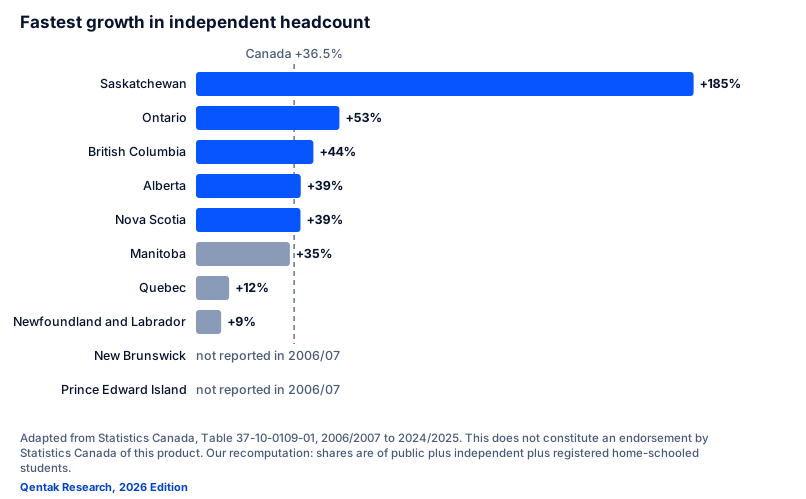
| Province | Independent students | Share of K-12 | Change in headcount since 2006/07 |
|---|---|---|---|
| Ontario | 175,350 | 7.7% | +53% |
| Quebec | 139,419 | 11.8% | +12% |
| British Columbia | 93,891 | 13.3% | +44% |
| Alberta | 39,969 | 4.9% | +39% |
| Manitoba | 16,920 | 7.7% | +35% |
| Saskatchewan | 5,694 | 2.7% | +185% |
| Nova Scotia | 4,719 | 3.4% | +39% |
| New Brunswick | 2,148 | 1.9% | not reported in 2006/07 |
| Prince Edward Island | 549 | 2.4% | not reported in 2006/07 |
| Newfoundland and Labrador | 912 | 1.4% | +9% |
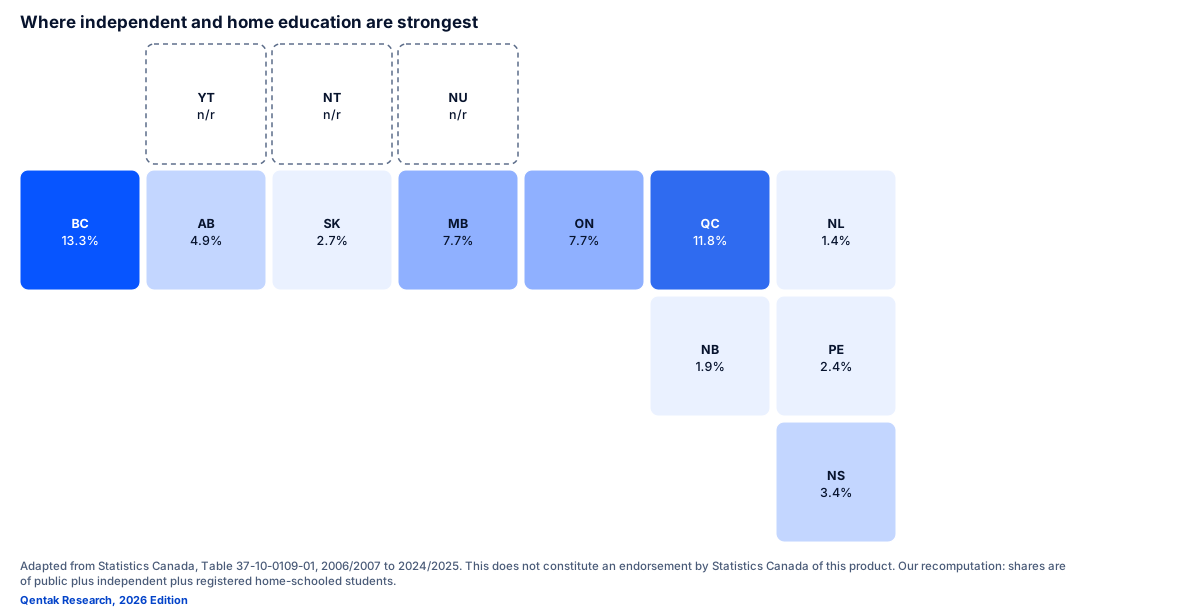
Fastest growth in independent headcount
Change in independent students, 2006/07 to 2024/25. Saskatchewan grew from a very small base.
| Province | 2006/07 independent | 2024/25 independent | Change |
|---|---|---|---|
| Saskatchewan | 1,998 | 5,694 | +185% |
| Ontario | 114,375 | 175,350 | +53% |
| British Columbia | 65,367 | 93,891 | +44% |
| Alberta | 28,767 | 39,969 | +39% |
| Nova Scotia | 3,399 | 4,719 | +39% |
| Manitoba | 12,543 | 16,920 | +35% |
| Quebec | 124,122 | 139,419 | +12% |
| Newfoundland and Labrador | 834 | 912 | +9% |
| New Brunswick | not reported | 2,148 | n/a |
| Prince Edward Island | not reported | 549 | n/a |
| Canada | 351,408 | 479,571 | +36.5% |
- Above the national change
- At or below the national change
Adapted from Statistics Canada, Table 37-10-0109-01, 2006/2007 to 2024/2025. This does not constitute an endorsement by Statistics Canada of this product. Our recomputation: shares are of public plus independent plus registered home-schooled students.
Cite this chart
Adapted from Statistics Canada, Table 37-10-0109-01, 2006/2007 to 2024/2025. This does not constitute an endorsement by Statistics Canada of this product. Our recomputation: shares are of public plus independent plus registered home-schooled students. Chart: "Fastest growth in independent headcount", Qentak Research, The State of Independent & Home Education in Canada, 2026 Edition. https://qentak.com/research/state-of-independent-and-home-education-canada-2026#chart-growth-ranked
Embed as an image
<figure>
  <img src="https://qentak.com/research/charts/growth-ranked.svg" alt="Ranked horizontal bars of independent headcount growth since 2006/07. Saskatchewan +185% is highest; Ontario +53%, British Columbia +44%; the national figure is +36.5%." width="800" style="max-width:100%;height:auto">
  <figcaption>Adapted from Statistics Canada, Table 37-10-0109-01, 2006/2007 to 2024/2025. This does not constitute an endorsement by Statistics Canada of this product. Our recomputation: shares are of public plus independent plus registered home-schooled students. Chart by <a href="https://qentak.com/research/state-of-independent-and-home-education-canada-2026#chart-growth-ranked">Qentak Research</a>.</figcaption>
</figure>
Qentak's own text and charts are free to share with attribution. Statistics Canada data is used under the Open Licence; the full chapter on data, sources and terms is on the data page.
Province explorer
Choose a province to see its series, funding model and sources.
Manitoba
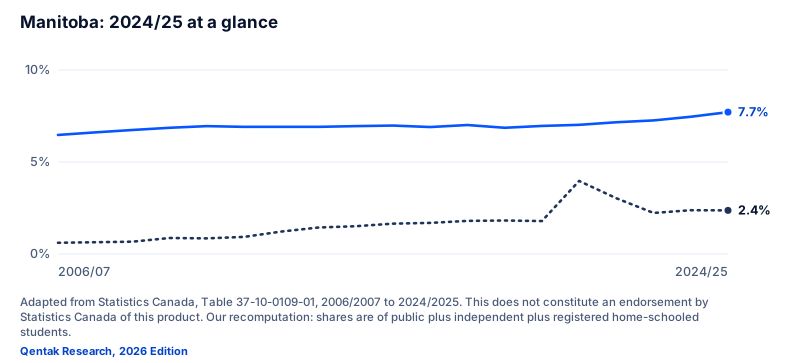
Manitoba: 2024/25 at a glance
16,920 independent students (7.7%); 5,199 registered home-educated (2.4%); funds independent schools at 50% of a public amount.
| School year | Independent | Independent share | Home-educated | Home-education share |
|---|---|---|---|---|
| 2006/07 | 12,543 | 6.47% | 1,176 | 0.61% |
| 2007/08 | 12,780 | 6.61% | 1,236 | 0.64% |
| 2008/09 | 12,951 | 6.74% | 1,290 | 0.67% |
| 2009/10 | 13,203 | 6.86% | 1,677 | 0.87% |
| 2010/11 | 13,398 | 6.95% | 1,635 | 0.85% |
| 2011/12 | 13,416 | 6.91% | 1,812 | 0.93% |
| 2012/13 | 13,491 | 6.91% | 2,385 | 1.22% |
| 2013/14 | 13,512 | 6.91% | 2,811 | 1.44% |
| 2014/15 | 13,641 | 6.95% | 2,964 | 1.51% |
| 2015/16 | 13,833 | 6.98% | 3,276 | 1.65% |
| 2016/17 | 13,815 | 6.90% | 3,393 | 1.69% |
| 2017/18 | 14,196 | 7.01% | 3,639 | 1.80% |
| 2018/19 | 14,019 | 6.86% | 3,708 | 1.82% |
| 2019/20 | 14,325 | 6.96% | 3,690 | 1.79% |
| 2020/21 | 14,184 | 7.02% | 8,028 | 3.97% |
| 2021/22 | 14,556 | 7.16% | 6,150 | 3.03% |
| 2022/23 | 15,099 | 7.26% | 4,629 | 2.23% |
| 2023/24 | 16,011 | 7.46% | 5,106 | 2.38% |
| 2024/25 | 16,920 | 7.71% | 5,199 | 2.37% |
- Independent share
- Registered home-education share
- Independent change since 2006/07+35%
- Fraser share, 2023/248.7%
- Outside public, 2024/2510.1%
Adapted from Statistics Canada, Table 37-10-0109-01, 2006/2007 to 2024/2025. This does not constitute an endorsement by Statistics Canada of this product. Our recomputation: shares are of public plus independent plus registered home-schooled students.
Cite this chart
Adapted from Statistics Canada, Table 37-10-0109-01, 2006/2007 to 2024/2025. This does not constitute an endorsement by Statistics Canada of this product. Our recomputation: shares are of public plus independent plus registered home-schooled students. Chart: "Manitoba: 2024/25 at a glance", Qentak Research, The State of Independent & Home Education in Canada, 2026 Edition. https://qentak.com/research/state-of-independent-and-home-education-canada-2026#chart-province-manitoba-snapshot
Embed as an image
<figure>
  <img src="https://qentak.com/research/charts/province-manitoba-snapshot.svg" alt="Line chart of Manitoba's independent share (solid) and registered home-education share (dotted) of K-12 students, 2006/07 to 2024/25." width="800" style="max-width:100%;height:auto">
  <figcaption>Adapted from Statistics Canada, Table 37-10-0109-01, 2006/2007 to 2024/2025. This does not constitute an endorsement by Statistics Canada of this product. Our recomputation: shares are of public plus independent plus registered home-schooled students. Chart by <a href="https://qentak.com/research/state-of-independent-and-home-education-canada-2026#chart-province-manitoba-snapshot">Qentak Research</a>.</figcaption>
</figure>
Qentak's own text and charts are free to share with attribution. Statistics Canada data is used under the Open Licence; the full chapter on data, sources and terms is on the data page.
Our recomputation from Statistics Canada, Table 37-10-0109-01 (regular programs for youth; share of public plus independent plus home-schooled students). Adapted from Statistics Canada; this does not constitute an endorsement by Statistics Canada of this product. Manitoba's Statistics Canada count includes Catholic schools; Manitoba's own ministry count is higher (see the Manitoba page).
Fraser's 2026 edition measures a little differently (ministry-based counts) and reports 2023/24 shares of 13.2% for British Columbia, 11.9% for Quebec, 8.7% for Manitoba, 7.4% for Ontario, 3.5% for Nova Scotia and 2.8% for Saskatchewan. Where the two sources differ, the cause is usually definition, not disagreement about the trend. The clearest case is Alberta: Fraser's 2026 share (6.7%) is well above Statistics Canada's (4.9%), apparently because Alberta Education counts students in supervised home-education programs inside the independent school authorities that supervise them. A Cardus memo of April 2026 found 15,332 of the 48,024 students reported under Alberta's independent authorities in 2024/25 were supervised home-education students. Each number is right for what it counts.
Two provinces deserve a second look.
Saskatchewan has grown fastest in relative terms, nearly tripling its independent headcount since 2006/07 from a very small base. The province began funding Qualified Independent Schools in 2012-13, and Cardus found enrolment up 24% in the six years that followed. But much of the growth was already under way before then, so we would not say funding alone caused it. We would say that growth has continued under a funding regime, and that the small base keeps the share low (2.7%).
British Columbia has the deepest independent-school ecosystem in Canada. Its funding model pays eligible independent schools 50% or 35% of the local public district's per-student operating grant, depending on the school's group. That keeps tuition within reach of many more families than in an unfunded province. Whether that explains BC's lead is a fair argument; in this report we offer it as a hypothesis, not a result.
Chapter 3 · 3 min
The Kitchen Table Story: Homeschooling Has More Than Tripled
Key takeaways
- Registered home education more than tripled between 2006/07 and 2021/22 and was 66,228 in 2024/25.
- Actual practice is estimated at roughly 80,000 to 100,000. That is an estimate, not a count.
- Alberta leads on both number and rate (3.2%).
Now for the part almost nobody is tracking.
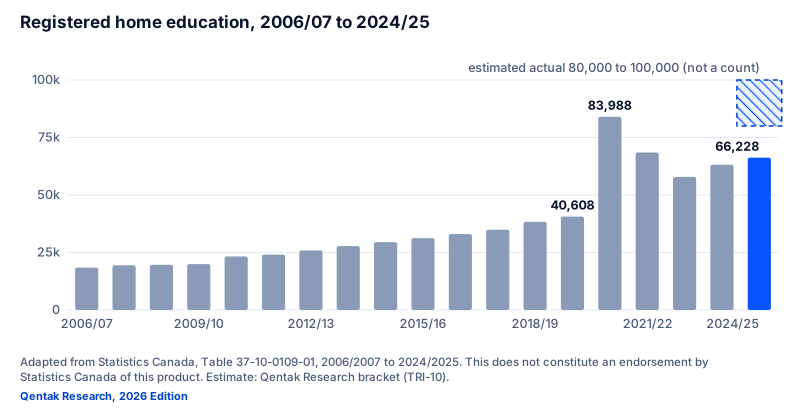
Between 2006/07 and 2021/22, registered homeschool enrolment in Canada more than tripled, a 264% increase (Cardus, from Statistics Canada), while public enrolment grew 4.5% and independent enrolment 23.8%. Then came the pandemic. Statistics Canada counted 40,608 home-schooled students in 2019/20 and 83,988 in 2020/21 (first published as 83,784): enrolment doubled in a single year. It eased to 68,466 in 2021/22 and 57,894 in 2022/23, then turned up again to 63,150 in 2023/24 and 66,228 in 2024/25.
Registered home education, 2006/07 to 2024/25
Reported counts for Canada. The hatched band is an estimate of actual practice, shown for 2024/25 only.
Estimate The band is an estimate, not a count. Registered figures are a floor.
| School year | Registered home-educated students |
|---|---|
| 2006/07 | 18,426 |
| 2007/08 | 19,422 |
| 2008/09 | 19,638 |
| 2009/10 | 19,983 |
| 2010/11 | 23,262 |
| 2011/12 | 24,078 |
| 2012/13 | 25,920 |
| 2013/14 | 27,804 |
| 2014/15 | 29,520 |
| 2015/16 | 31,245 |
| 2016/17 | 33,006 |
| 2017/18 | 34,911 |
| 2018/19 | 38,346 |
| 2019/20 | 40,608 |
| 2020/21 | 83,988 |
| 2021/22 | 68,466 |
| 2022/23 | 57,894 |
| 2023/24 | 63,150 |
| 2024/25 | 66,228 |
| 2024/25 estimate (not a count) | 80,000 to 100,000 |
Adapted from Statistics Canada, Table 37-10-0109-01, 2006/2007 to 2024/2025. This does not constitute an endorsement by Statistics Canada of this product. Estimate: Qentak Research bracket (TRI-10).
Cite this chart
Adapted from Statistics Canada, Table 37-10-0109-01, 2006/2007 to 2024/2025. This does not constitute an endorsement by Statistics Canada of this product. Estimate: Qentak Research bracket (TRI-10). Chart: "Registered home education, 2006/07 to 2024/25", Qentak Research, The State of Independent & Home Education in Canada, 2026 Edition. https://qentak.com/research/state-of-independent-and-home-education-canada-2026#chart-homeschool-reported-series
Embed as an image
<figure>
  <img src="https://qentak.com/research/charts/homeschool-reported-series.svg" alt="Columns of reported home-educated students in Canada: 40,608 in 2019/20, 83,988 in 2020/21 and 66,228 in 2024/25, with a hatched band from 80,000 to 100,000 marking the estimated actual number in 2024/25." width="800" style="max-width:100%;height:auto">
  <figcaption>Adapted from Statistics Canada, Table 37-10-0109-01, 2006/2007 to 2024/2025. This does not constitute an endorsement by Statistics Canada of this product. Estimate: Qentak Research bracket (TRI-10). Chart by <a href="https://qentak.com/research/state-of-independent-and-home-education-canada-2026#chart-homeschool-reported-series">Qentak Research</a>.</figcaption>
</figure>
Qentak's own text and charts are free to share with attribution. Statistics Canada data is used under the Open Licence; the full chapter on data, sources and terms is on the data page.
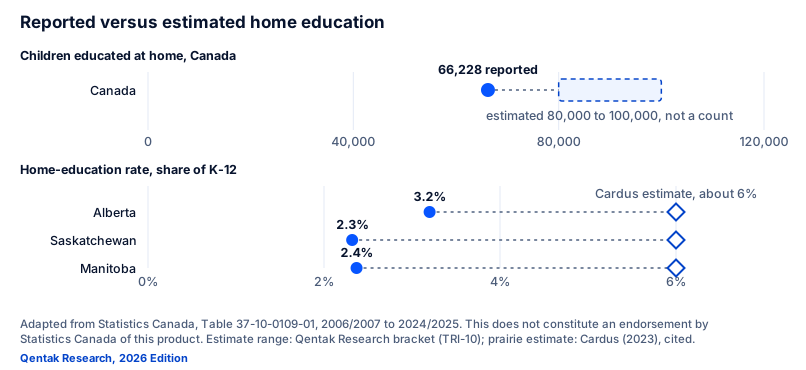
Reported versus estimated home education
Solid dots are registered counts. Hollow shapes and dashed boxes are estimates.
Estimate No agency counts unregistered home educators. The range is our arithmetic from published material.
| Measure | Reported | Estimate | Type |
|---|---|---|---|
| Canada, children educated at home | 66,228 | 80,000 to 100,000 | estimate |
| Alberta, share of K-12 | 3.2% | about 6% (Cardus) | estimate |
| Saskatchewan, share of K-12 | 2.3% | about 6% (Cardus) | estimate |
| Manitoba, share of K-12 | 2.4% | about 6% (Cardus) | estimate |
- Reported (registered)
- Estimated range
- Cardus estimate
Confidence: low (estimate); high for the 66,000 reported floor. Basis: Floor 66,228 (StatCan reported). Two heuristics: reported +20-30% (a homeschool-sector blog, unsourced) gives 79,000-86,000; Cardus's statement that prairie rates are closer to 6% than the reported ~3% (about double), applied to AB+SK+MB only (about 36,000 reported), adds roughly 36,000 and gives about 100,000-102,000
Adapted from Statistics Canada, Table 37-10-0109-01, 2006/2007 to 2024/2025. This does not constitute an endorsement by Statistics Canada of this product. Estimate range: Qentak Research bracket (TRI-10); prairie estimate: Cardus (2023), cited.
Cite this chart
Adapted from Statistics Canada, Table 37-10-0109-01, 2006/2007 to 2024/2025. This does not constitute an endorsement by Statistics Canada of this product. Estimate range: Qentak Research bracket (TRI-10); prairie estimate: Cardus (2023), cited. Chart: "Reported versus estimated home education", Qentak Research, The State of Independent & Home Education in Canada, 2026 Edition. https://qentak.com/research/state-of-independent-and-home-education-canada-2026#chart-reported-vs-estimated
Embed as an image
<figure>
  <img src="https://qentak.com/research/charts/reported-vs-estimated.svg" alt="Reported registered home education in Canada is 66,228; our estimate of actual practice is 80,000 to 100,000. In Alberta, Saskatchewan and Manitoba the reported rate is 2.3% to 3.2% against a Cardus estimate of about 6%." width="800" style="max-width:100%;height:auto">
  <figcaption>Adapted from Statistics Canada, Table 37-10-0109-01, 2006/2007 to 2024/2025. This does not constitute an endorsement by Statistics Canada of this product. Estimate range: Qentak Research bracket (TRI-10); prairie estimate: Cardus (2023), cited. Chart by <a href="https://qentak.com/research/state-of-independent-and-home-education-canada-2026#chart-reported-vs-estimated">Qentak Research</a>.</figcaption>
</figure>
Qentak's own text and charts are free to share with attribution. Statistics Canada data is used under the Open Licence; the full chapter on data, sources and terms is on the data page.
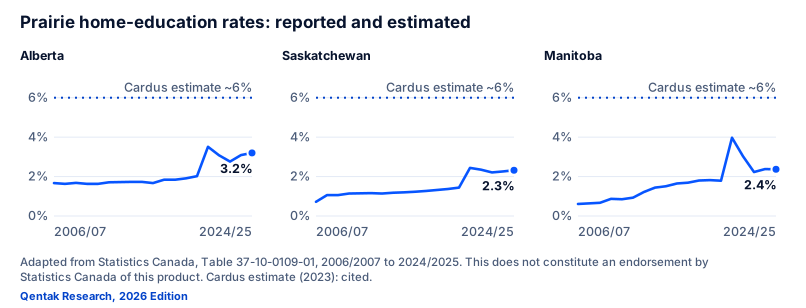
Two things stand out. First, the pandemic spike did not fully reverse: reported home education in 2024/25 is still about 63% higher than in 2019/20. Second, these are registered students. Reporting rules differ by province, and families who do not register are invisible to official statistics. Cardus notes that Statistics Canada's own figures under-report, and that "credible estimates peg homeschoolers closer to 6 percent in the prairie provinces" against a reported rate of nearly 3% in Saskatchewan and Alberta.
How large is the true number? Nobody knows, and we will not pretend to. Our own bracketing, from the published material: registered enrolment of about 66,000 is the floor. If actual practice runs 20% to 30% above registered numbers, as home-education advocates commonly argue, that is roughly 80,000 to 86,000. If Cardus's prairie estimate (about double the reported rate) is applied to Alberta, Saskatchewan and Manitoba and nowhere else, it adds about 36,000 children and brings the total near 100,000. So "roughly 100,000 children" is a defensible estimate at the top of a range of about 80,000 to 100,000. It is not a count, and no agency publishes one.
Provincial snapshot: registered home education
| Province | 2019/20 | 2021/22 | 2024/25 | Share of K-12, 2024/25 |
|---|---|---|---|---|
| Alberta | 14,730 | 22,539 | 25,977 | 3.2%, highest among provinces |
| Ontario | 9,888 | 16,404 | 13,269 | 0.6% |
| Quebec | 4,308 | 9,165 | 7,851 | 0.7% |
| Manitoba | 3,690 | 6,150 | 5,199 | 2.4% (ministry: 5,531, Oct 2025) |
| Saskatchewan | 2,781 | 4,539 | 4,821 | 2.3% |
| British Columbia | 2,454 | 4,515 | 4,458 | 0.6% |
| Nova Scotia | 1,134 | 1,707 | 1,860 | 1.3% |
| New Brunswick | 942 | 2,259 | 1,734 | 1.5% |
Source: Statistics Canada, Table 37-10-0109-01. Prince Edward Island, Newfoundland and Labrador and the territories are on their own pages.
Alberta reports the most home-educated children and the highest rate among the provinces. (The Yukon's rate is higher still, on a very small base.) Alberta Education's own count for 2024/25, 24,158 home-education students plus 2,274 in shared-responsibility programs, agrees with Statistics Canada. Ontario is a clear second. Ontario does have the largest number of independent and home-educated students combined, simply because it is the largest province.
British Columbia's home-education numbers have a longer history than the table shows. Fraser's 2022 edition found BC the one province where home education had not risen over its window. Statistics Canada's series now shows BC up from 2,454 (2019/20) to 4,458 (2024/25), with a break in the series in 2009/10, so we treat any "BC is declining" claim as dated.
Why the prairie provinces lead. Alberta, Saskatchewan and Manitoba combine light legal frameworks with strong home-education communities, and Alberta also funds supervised home education: $901 per Grade 1-12 student ($450.50 for early childhood) in supervised programs in 2025-26. Manitoba requires only annual notification and two progress reports and gives families no provincial funding. Saskatchewan leaves funding to school divisions (one division's grant is $800 per elementary student for materials, another reimburses up to $1,000; we found no single provincial rule). The pattern holds across the three: where home education is legible to the authority and easy to register, reported rates run at two to three times the national rate (2.3% to 3.2% against 1.1%). Whether funding, friction or culture explains the difference is something this data cannot tell us.
Prairie home-education rates: reported and estimated
Reported share of K-12 by year. The dotted line is Cardus's estimate of the true rate.
Estimate The dotted line at about 6% is an estimate by Cardus, not a count.
| School year | Alberta | Saskatchewan | Manitoba |
|---|---|---|---|
| 2006/07 | 1.67% | 0.72% | 0.61% |
| 2007/08 | 1.63% | 1.06% | 0.64% |
| 2008/09 | 1.68% | 1.06% | 0.67% |
| 2009/10 | 1.63% | 1.14% | 0.87% |
| 2010/11 | 1.63% | 1.15% | 0.85% |
| 2011/12 | 1.71% | 1.16% | 0.93% |
| 2012/13 | 1.72% | 1.14% | 1.22% |
| 2013/14 | 1.73% | 1.18% | 1.44% |
| 2014/15 | 1.73% | 1.20% | 1.51% |
| 2015/16 | 1.67% | 1.23% | 1.65% |
| 2016/17 | 1.84% | 1.27% | 1.69% |
| 2017/18 | 1.84% | 1.32% | 1.80% |
| 2018/19 | 1.91% | 1.37% | 1.82% |
| 2019/20 | 2.02% | 1.44% | 1.79% |
| 2020/21 | 3.51% | 2.44% | 3.97% |
| 2021/22 | 3.08% | 2.35% | 3.03% |
| 2022/23 | 2.76% | 2.21% | 2.23% |
| 2023/24 | 3.09% | 2.26% | 2.38% |
| 2024/25 | 3.20% | 2.32% | 2.37% |
Confidence (TRI-11): high (reported), low (estimated). 1.4-3.2% reported depending on year; about 6% estimated (Cardus)
Adapted from Statistics Canada, Table 37-10-0109-01, 2006/2007 to 2024/2025. This does not constitute an endorsement by Statistics Canada of this product. Cardus estimate (2023): cited.
Cite this chart
Adapted from Statistics Canada, Table 37-10-0109-01, 2006/2007 to 2024/2025. This does not constitute an endorsement by Statistics Canada of this product. Cardus estimate (2023): cited. Chart: "Prairie home-education rates: reported and estimated", Qentak Research, The State of Independent & Home Education in Canada, 2026 Edition. https://qentak.com/research/state-of-independent-and-home-education-canada-2026#chart-homeschool-prairie-rates
Embed as an image
<figure>
  <img src="https://qentak.com/research/charts/homeschool-prairie-rates.svg" alt="Three small line charts for Alberta, Saskatchewan and Manitoba of the reported home-education share from 2006/07 to 2024/25, each with a dotted marker at the Cardus estimate of about 6 percent." width="800" style="max-width:100%;height:auto">
  <figcaption>Adapted from Statistics Canada, Table 37-10-0109-01, 2006/2007 to 2024/2025. This does not constitute an endorsement by Statistics Canada of this product. Cardus estimate (2023): cited. Chart by <a href="https://qentak.com/research/state-of-independent-and-home-education-canada-2026#chart-homeschool-prairie-rates">Qentak Research</a>.</figcaption>
</figure>
Qentak's own text and charts are free to share with attribution. Statistics Canada data is used under the Open Licence; the full chapter on data, sources and terms is on the data page.
Why this matters beyond the homeschool community. Home-educated students are not a fringe. At about 66,000 registered (and plausibly more in practice), they outnumber the independent-school students of every province except Ontario, Quebec and British Columbia. They are grandparents teaching Tuesday and Thursday, co-ops run out of church basements, and families who tried the system, found it wanting, and quietly built something else. Their children will, in a few years, arrive at high schools, colleges and universities with records that somebody, some office, has to know how to read.
That somebody should not be a photocopier in a basement. More on that in Section 5.
Chapter 4 · 2 min
The Money: Funding Models Decide a Lot
Key takeaways
- Five provinces fund independent schools at roughly 35% to 70% of a public amount, each on its own basis.
- The three deepest independent markets by share are all funding provinces, yet unfunded Ontario still has the most students.
- Public spending per student ranged from $13,494 (Alberta) to $19,484 (Quebec) in 2022/23.
Here is the map that explains much of the rest.
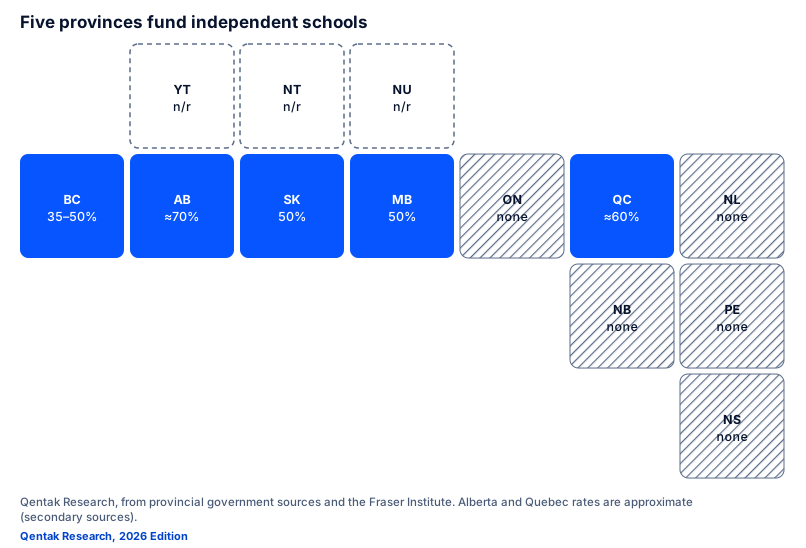
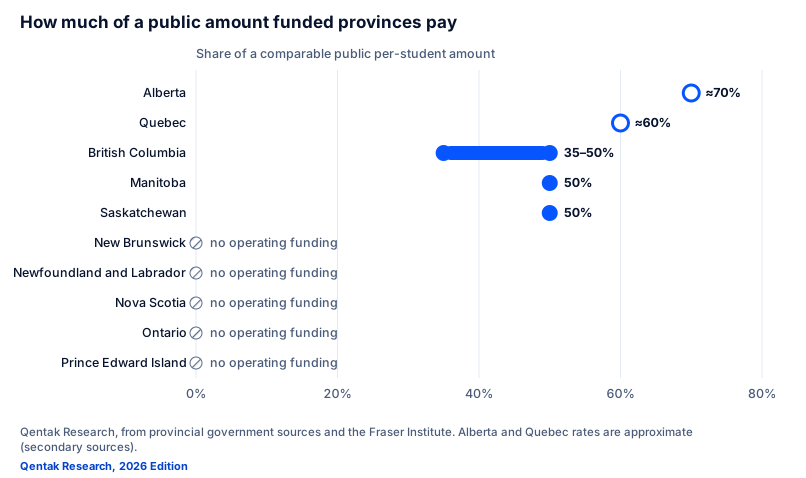
Five provinces partially fund the operating costs of independent schools on a per-student basis: British Columbia, Alberta, Saskatchewan, Manitoba and Quebec. Five do not: Ontario, New Brunswick, Nova Scotia, Prince Edward Island and Newfoundland and Labrador. The funded provinces pay roughly 35% to 70% of a comparable public amount, each on its own basis, so the percentages are not directly comparable:
Five provinces fund independent schools
Operating funding per student, as a share of a public amount. Each province uses its own basis.
| Province | Funds independent schools | Share of public amount | Basis |
|---|---|---|---|
| British Columbia | Yes | 35–50% | Group 1 = 50%, Group 2 = 35% of the local public school district per-student operating grant (school is placed by comparing its per-student operating cost with the district grant). Distributed learning moved to 50/35 from 2020/21. |
| Alberta | Yes | ≈70% | Accredited funded private/independent schools receive about 70% of public per-student funding on most grants (100% for some categories, e.g. ECS or complexity per secondary sources); new operators ineligible in year 1. |
| Saskatchewan | Yes | 50% | Qualified Independent Schools: 50% of the provincial per-student average on actual eligible registered students (2022 release also described an incremental rate at 400+ students; unconfirmed). |
| Manitoba | Yes | 50% | Funded independent schools: Instruction and Services grant = lesser of $6,837 per eligible pupil or the school's eligible operating cost, where the per-pupil rate is derived from 50% of the 2023/24 net operating cost per FTE public pupil (2025/26). Plus special needs L2 $9,500 / L3 $21,130, curricular materials $60, and indirect shared services (clinician, facilities, transport). |
| Quebec | Yes | ≈60% | Subsidised private schools receive about 60% of the public per-pupil amount for educational services only (no buildings or student services); one comparison cites about 50%. |
| Ontario | No | 0% | No operating funding for independent schools. |
| Nova Scotia | No | 0% | No operating funding for independent schools. |
| New Brunswick | No | 0% | No operating funding for independent schools. |
| Prince Edward Island | No | 0% | No operating funding for independent schools. |
| Newfoundland and Labrador | No | 0% | No operating funding for independent schools. |
- Funds independent schools
- No operating funding
- Not researched
Hover or focus a tile for the funding basis.
≈ marks an approximate figure that rests on several consistent secondary sources (Alberta and Quebec); the primary funding manuals were not read.
Qentak Research, from provincial government sources and the Fraser Institute. Alberta and Quebec rates are approximate (secondary sources).
Cite this chart
Qentak Research, from provincial government sources and the Fraser Institute. Alberta and Quebec rates are approximate (secondary sources). Chart: "Five provinces fund independent schools", Qentak Research, The State of Independent & Home Education in Canada, 2026 Edition. https://qentak.com/research/state-of-independent-and-home-education-canada-2026#chart-funding-map
Embed as an image
<figure>
  <img src="https://qentak.com/research/charts/funding-map.svg" alt="A tile map of Canada. British Columbia, Alberta, Saskatchewan, Manitoba and Quebec partially fund independent schools; Ontario and the four Atlantic provinces do not. The territories were not researched." width="800" style="max-width:100%;height:auto">
  <figcaption>Qentak Research, from provincial government sources and the Fraser Institute. Alberta and Quebec rates are approximate (secondary sources). Chart by <a href="https://qentak.com/research/state-of-independent-and-home-education-canada-2026#chart-funding-map">Qentak Research</a>.</figcaption>
</figure>
Qentak's own text and charts are free to share with attribution. Statistics Canada data is used under the Open Licence; the full chapter on data, sources and terms is on the data page.
| Province | Mechanism |
|---|---|
| British Columbia | 50% (Group 1) or 35% (Group 2) of the local public school district's per-student operating grant |
| Alberta | About 70% of public base instruction rates (100% for some categories) |
| Saskatchewan | 50% of the provincial per-student average for Qualified Independent Schools |
| Manitoba | 50% of the public net operating cost per full-time-equivalent pupil, capped at $6,837 per eligible pupil for 2025/26, plus special-needs and materials grants |
| Quebec | About 60% of the public per-pupil amount for educational services only (not buildings or student services) |
How much of a public amount funded provinces pay
Bars show ranges; hollow markers are approximate. The bases differ, so the percentages are not directly comparable.
Estimate Alberta and Quebec rates are approximate and rest on secondary sources.
| Province | Share of public amount | Status | Basis |
|---|---|---|---|
| Alberta | ≈70% | approximate | Accredited funded private/independent schools receive about 70% of public per-student funding on most grants (100% for some categories, e.g. ECS or complexity per secondary sources); new operators ineligible in year 1. |
| Quebec | ≈60% | approximate | Subsidised private schools receive about 60% of the public per-pupil amount for educational services only (no buildings or student services); one comparison cites about 50%. |
| British Columbia | 35–50% | verified | Group 1 = 50%, Group 2 = 35% of the local public school district per-student operating grant (school is placed by comparing its per-student operating cost with the district grant). Distributed learning moved to 50/35 from 2020/21. |
| Manitoba | 50% | verified | Funded independent schools: Instruction and Services grant = lesser of $6,837 per eligible pupil or the school's eligible operating cost, where the per-pupil rate is derived from 50% of the 2023/24 net operating cost per FTE public pupil (2025/26). Plus special needs L2 $9,500 / L3 $21,130, curricular materials $60, and indirect shared services (clinician, facilities, transport). |
| Saskatchewan | 50% | verified | Qualified Independent Schools: 50% of the provincial per-student average on actual eligible registered students (2022 release also described an incremental rate at 400+ students; unconfirmed). |
| New Brunswick | 0% | no funding | No operating funding for independent schools. |
| Newfoundland and Labrador | 0% | no funding | No operating funding for independent schools. |
| Nova Scotia | 0% | no funding | No operating funding for independent schools. |
| Ontario | 0% | no funding | No operating funding for independent schools. |
| Prince Edward Island | 0% | no funding | No operating funding for independent schools. |
- Verified from government text
- Approximate (secondary sources)
Confidence (TRI-17): high for BC, SK, MB; medium for AB and QC. BC 35-50 (official); SK 50 (official); MB 50 (official); QC 50-60 (secondary: Policy Alternatives, FEEP, others; FEEP says the subsidy is about 40% of total cost); AB 70 (CBC, Alberta School Councils, a blog quoting the manual; Funding Manual not read). No source for 80%
Qentak Research, from provincial government sources and the Fraser Institute. Alberta and Quebec rates are approximate (secondary sources).
Cite this chart
Qentak Research, from provincial government sources and the Fraser Institute. Alberta and Quebec rates are approximate (secondary sources). Chart: "How much of a public amount funded provinces pay", Qentak Research, The State of Independent & Home Education in Canada, 2026 Edition. https://qentak.com/research/state-of-independent-and-home-education-canada-2026#chart-funding-ladder
Embed as an image
<figure>
  <img src="https://qentak.com/research/charts/funding-ladder.svg" alt="A dot and range plot: British Columbia 35 to 50 percent, Saskatchewan 50, Manitoba 50, Quebec about 60 and Alberta about 70 percent of a public per-student amount; Ontario and four Atlantic provinces provide none." width="800" style="max-width:100%;height:auto">
  <figcaption>Qentak Research, from provincial government sources and the Fraser Institute. Alberta and Quebec rates are approximate (secondary sources). Chart by <a href="https://qentak.com/research/state-of-independent-and-home-education-canada-2026#chart-funding-ladder">Qentak Research</a>.</figcaption>
</figure>
Qentak's own text and charts are free to share with attribution. Statistics Canada data is used under the Open Licence; the full chapter on data, sources and terms is on the data page.
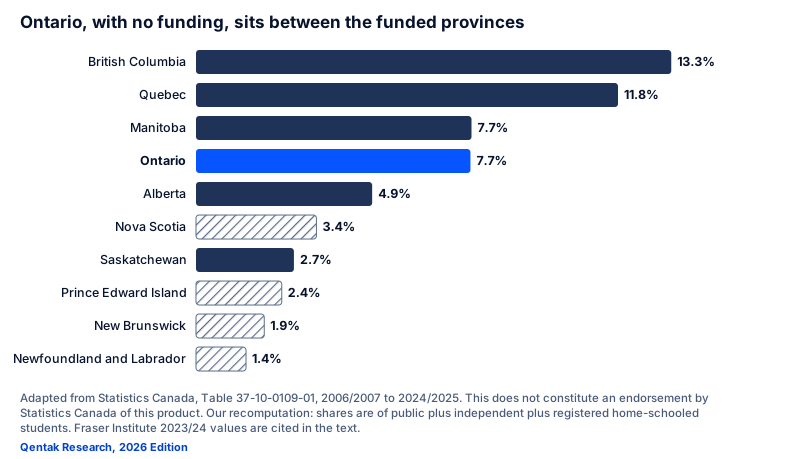
The three deepest independent markets in Canada by share, British Columbia (13.2%), Quebec (11.9%) and Manitoba (8.7%) on Fraser's 2023/24 measure, are all funding provinces. Ontario, which funds nothing, has the largest absolute number of independent students (about 175,000) and a share of 7.4% to 7.7%. That rate is below British Columbia's and Quebec's, below Manitoba's on Fraser's measure (level with it on Statistics Canada's), and above Alberta's and Saskatchewan's on both. In other words: funding plainly helps, but Ontario shows that a large, unfunded independent sector can still grow.
Ontario, with no funding, sits between the funded provinces
Independent share of K-12 students, 2024/25. Ontario is above Alberta and Saskatchewan, below British Columbia and Quebec, and level with Manitoba.
| Province | Independent share | Funds independent schools |
|---|---|---|
| British Columbia | 13.30% | Yes |
| Quebec | 11.81% | Yes |
| Manitoba | 7.71% | Yes |
| Ontario | 7.68% | No |
| Alberta | 4.93% | Yes |
| Nova Scotia | 3.37% | No |
| Saskatchewan | 2.74% | Yes |
| Prince Edward Island | 2.40% | No |
| New Brunswick | 1.91% | No |
| Newfoundland and Labrador | 1.40% | No |
- Ontario (no operating funding)
- Province that funds independent schools
- No operating funding
Adapted from Statistics Canada, Table 37-10-0109-01, 2006/2007 to 2024/2025. This does not constitute an endorsement by Statistics Canada of this product. Our recomputation: shares are of public plus independent plus registered home-schooled students. Fraser Institute 2023/24 values are cited in the text.
Cite this chart
Adapted from Statistics Canada, Table 37-10-0109-01, 2006/2007 to 2024/2025. This does not constitute an endorsement by Statistics Canada of this product. Our recomputation: shares are of public plus independent plus registered home-schooled students. Fraser Institute 2023/24 values are cited in the text. Chart: "Ontario, with no funding, sits between the funded provinces", Qentak Research, The State of Independent & Home Education in Canada, 2026 Edition. https://qentak.com/research/state-of-independent-and-home-education-canada-2026#chart-ontario-vs-funded
Embed as an image
<figure>
  <img src="https://qentak.com/research/charts/ontario-vs-funded.svg" alt="Ranked bars of independent share by province. Ontario is highlighted. Funded provinces are solid dark bars; unfunded provinces are hatched." width="800" style="max-width:100%;height:auto">
  <figcaption>Adapted from Statistics Canada, Table 37-10-0109-01, 2006/2007 to 2024/2025. This does not constitute an endorsement by Statistics Canada of this product. Our recomputation: shares are of public plus independent plus registered home-schooled students. Fraser Institute 2023/24 values are cited in the text. Chart by <a href="https://qentak.com/research/state-of-independent-and-home-education-canada-2026#chart-ontario-vs-funded">Qentak Research</a>.</figcaption>
</figure>
Qentak's own text and charts are free to share with attribution. Statistics Canada data is used under the Open Licence; the full chapter on data, sources and terms is on the data page.
Funding does not just grow independent schools. It changes who can afford them. In British Columbia a funded model means tuition can be set lower than in an unfunded province. That is a plausible reason one in seven BC students is in an independent school, and a hypothesis worth testing.
Meanwhile the amounts of money moving around are large.
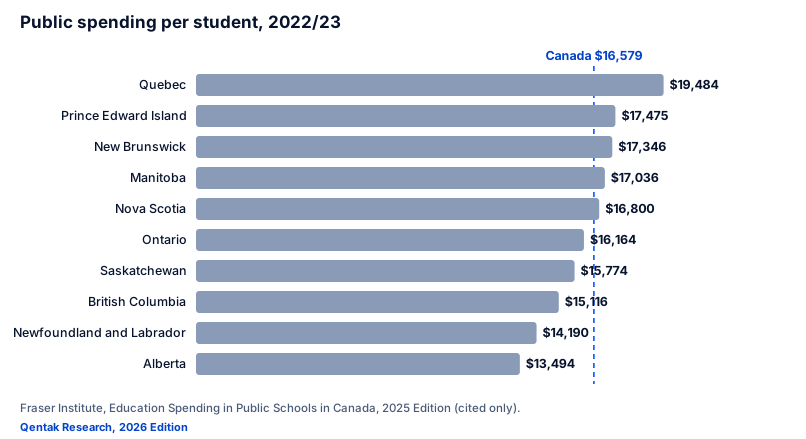
- Public per-student spending ranged from $13,494 (Alberta) to $19,484 (Quebec) in 2022/23, with a national average of $16,579 (Fraser Institute, Education Spending in Public Schools in Canada, 2025 Edition; this is total spending per student, not only operating grants). Every enrolment shift moves five figures of public money per child, per year. Fraser's 2026 edition (data to 2023/24) reports total public spending up 44.8% since 2014/15.
- Edtech is a large and fast-growing market, though published estimates differ several-fold by definition. Analyst firms' public estimates of Canada's education-technology market for 2025 run from low single-digit to low double-digit billions of US dollars depending on how broadly the market is drawn, with growth forecasts of roughly 11% to 14% a year. We do not quote a single figure because the firms define the market differently.
- Tuition. Independent-school tuition varies enormously by province, funding status and school type, and we have not found a source that supports a single national range. We would rather publish none than a number we cannot stand behind (see Section 7).
Public spending per student, 2022/23
Total public spending per student, not only operating grants. Every enrolment shift moves five figures of public money per child per year.
| Province | Spending per student (CAD, 2022/23) |
|---|---|
| Quebec | $19,484 |
| Prince Edward Island | $17,475 |
| New Brunswick | $17,346 |
| Manitoba | $17,036 |
| Nova Scotia | $16,800 |
| Ontario | $16,164 |
| Saskatchewan | $15,774 |
| British Columbia | $15,116 |
| Newfoundland and Labrador | $14,190 |
| Alberta | $13,494 |
| Canada | $16,579 |
Fraser Institute, Education Spending in Public Schools in Canada, 2025 Edition (cited only).
Cite this chart
Fraser Institute, Education Spending in Public Schools in Canada, 2025 Edition (cited only). Chart: "Public spending per student, 2022/23", Qentak Research, The State of Independent & Home Education in Canada, 2026 Edition. https://qentak.com/research/state-of-independent-and-home-education-canada-2026#chart-per-student-spending
Embed as an image
<figure>
  <img src="https://qentak.com/research/charts/per-student-spending.svg" alt="Sorted bars of public spending per student by province, from $13,494 in Alberta to $19,484 in Quebec, with the national average of $16,579 marked." width="800" style="max-width:100%;height:auto">
  <figcaption>Fraser Institute, Education Spending in Public Schools in Canada, 2025 Edition (cited only). Chart by <a href="https://qentak.com/research/state-of-independent-and-home-education-canada-2026#chart-per-student-spending">Qentak Research</a>.</figcaption>
</figure>
Qentak's own text and charts are free to share with attribution. Statistics Canada data is used under the Open Licence; the full chapter on data, sources and terms is on the data page.
The money is large, mobile and increasingly attached to parental decisions rather than institutional ones. Systems built on the assumption that children flow to the nearest public school are running on arithmetic from 1985.
Chapter 5 · 3 min
The Gap Nobody Talks About: The Tools Haven't Noticed
Key takeaways
- This chapter is analysis and opinion, and is labelled as such.
- The PowerSchool findings establish that a public body does not outsource accountability when it outsources a service.
- The gap is fit: provincial rules as configuration, data residency, Canadian payment methods, English and French.
Now we come to the part of this report that is opinion. We will label it clearly, and we will defend it as far as the evidence allows, because we believe it is the most actionable finding of 2026.
The software built for Canadian education was designed for a world that is changing.
Look at what the data says: decentralized choice, thousands of small schools, tens of thousands of kitchen-table learners, five different provincial funding regimes, two official languages, and a privacy landscape that is genuinely Canadian and genuinely complex: PIPEDA federally; FIPPA and MFIPPA in Ontario; Alberta's Protection of Privacy Act (in force since June 2025, replacing FOIP for public bodies); British Columbia's FOIPPA; and Quebec's Law 25. Quebec's Bill 96, a language law, sits beside them on the same procurement checklist.
Now ask what schools actually run. We do not have a survey, and we will not pretend to one, so here instead are questions for you to answer about your own school or household:
- Does your school run a student information system built first for US districts (sold in modules, priced for American budgets, contracted on American timelines) and then bolt on a learning platform, a separate fee-payment service, a parent-communication app, a lunch-ordering system, an enrolment form builder and a spreadsheet holding the whole thing together? How many separate systems hold some part of one child's record?
- If you home-educate in Manitoba, the Homeschooling Office currently asks for a progress report for each child by January 31 and another by June 30 (the statute leaves the schedule to the Minister). What do you assemble them from: binders, printables, memory?
- If you run a school or a division: if your student-information vendor had a breach tomorrow, could you say who had access to what?
That last question is not hypothetical. In November 2025 the privacy commissioners of Alberta and Ontario released their findings on the PowerSchool breach. Alberta's report (F2025-IR-02) made 22 recommendations: six to educational bodies, thirteen to PowerSchool and three to government. It also made the point that matters most to anyone buying software: a public body does not outsource its accountability when it outsources a service. Ontario's Information and Privacy Commissioner reached the same view, finding that the institutions lacked reasonable measures to prevent unauthorized access and requiring school boards to show compliance within six months. The recommendations Ontario reported concerned contract terms, vendor oversight, restricting remote access, and breach response.
Many of the most widely used student systems were designed first for large US districts: enterprise budgets, federal rather than provincial privacy law, and feature roadmaps shaped by acquisition more than by the daily reality of a 120-student independent school in Steinbach or a homeschool co-op in Kelowna. That is our reading, and an opinion; the vendors are not malicious.
The gap is not features. The gap is fit. Fit means provincial reporting held as configuration instead of code; a choice about where your data lives; ways to pay that Canadian families actually use; English and French; contracts a small school can sign without a lawyer; and security that is an identity rather than a checkbox.
We build for that gap, so read this section with that in mind. Qentak operates data centres in Canada, the United States and the EU, among other jurisdictions, and supports choosing where a school's data resides. Our product direction, as set out in our build plan, is to hold provincial home-education and school rules as configuration (jurisdiction packs for Manitoba, Ontario, British Columbia, Alberta, Quebec, Saskatchewan, Nova Scotia and New Brunswick, currently in draft and not legal advice); to design fee payment around Interac e-Transfer and pre-authorized debit alongside cards; to support English and French; and to give home-education co-ops and umbrella schools a household-based record, a compliance calendar and portfolio evidence that travels with the learner. We make no certification claims in this report.
Chapter 6 · 1 min
What We Predict for 2027
Key takeaways
- Five predictions, each stated so the 2027 edition can mark it right or wrong.
- Registered independent plus home education is expected to pass 10% of students on the Statistics Canada basis.
Annual reports earn their keep by sticking their necks out. Here are our five predictions, each stated so that next year's edition can mark it right or wrong.
- The non-public share keeps climbing, and registered independent plus home education passes 10% of students on Statistics Canada's basis within two to three releases. It was 9.5% in 2024/25 on our recomputation (independent 8.3% plus home education 1.2%, on our base). Independent headcount has compounded at 1.7% a year since 2006/07 and 3.4% a year over the last three years, so we expect Statistics Canada's own independent share (8.0% in 2024/25) to reach 8.5% soon. British Columbia stays near 13% to 14%; the prairies' home-education rates stay well above the national rate.
- Ontario becomes the policy battleground. With about 175,000 independent students and no operating funding, pressure for "money follows the child" reform will build. Ontario's reported home-educated population (13,269 in 2024/25, up from 9,888 in 2019/20) will be understood as a floor, not a total.
- The PowerSchool precedent rewires procurement. Post-breach findings from Alberta (22 recommendations, accountability not outsourced) and Ontario (reasonable-safeguards and vendor-oversight findings) will push schools to demand auditable security, data residency and exit rights. Vendors that cannot show their work will lose RFPs they used to win.
- Homeschool-to-school pipelines formalize. As co-ops, pods and hybrid arrangements mature, the artificial wall between "homeschool tools" and "school software" will collapse. The winning platform will be one whose student record works at the kitchen table and the front office, because increasingly the same child is in both places.
- Consolidation bites back. Ask a small independent school to list every system it pays for and add up the cost. We expect more of them to do it, driven by CFOs rather than IT, and that "one platform, one record, Canadian law" becomes a procurement criterion and not a slogan. We have no survey behind this one; it is a prediction, and we will report next year on whether it came true.
Chapter 7 · 3 min
Methodology, Data Sources and Honest Limitations
Key takeaways
- Several independent sources per key figure; differences reconciled by cause.
- Seven stated limitations, including that no agency counts unregistered home educators.
- The publisher builds software for this sector and says so.
The full methodology, with exact attribution strings, is in the methodology note. This is the summary.
Sources. Enrolment trends: Statistics Canada, Table 37-10-0109-01 (public, private/independent and home-schooled students by province, 2006/07 to 2024/25, released 4 November 2026) and The Daily, 4 November 2026; Fraser Institute, Where Our Students Are Educated: Measuring Student Enrolment in Canada, 2026 (September 2026; data 2000/01 to 2023/24) and its 2022 edition (data to 2019/20). Independent-school portrait: Van Pelt and Allison, A Diverse Landscape: Independent Schools in Canada (Fraser Institute, 2016). Home-education trends and estimates: Deani Van Pelt, Charting New Horizons for Independent Education in Canada (Cardus, December 2023, CC BY-NC-ND 4.0); Cardus, Better Together (April 2026); Cardus memo on Alberta student population statistics (April 2026). Manitoba: Manitoba Education and Early Childhood Learning, Enrolment Report, October 1, 2025 and Funding of Independent Schools and Reporting Requirements, 2025/2026; the Manitoba Homeschooling Office. Funding: provincial government pages for British Columbia and Saskatchewan; Manitoba's funding guide; for Alberta and Quebec, several consistent secondary sources pending the primary funding manuals. Public per-student spending: Fraser Institute, Education Spending in Public Schools in Canada, 2025 Edition. Privacy: Alberta OIPC, Investigation Report F2025-IR-02 (17 November 2025); Ontario IPC PowerSchool investigation (17 November 2025), read through published summaries.
How we handled disagreement between sources. For each key figure we looked at several independent sources and reconciled differences by cause: share vs headcount, independent-only vs independent plus home education, registered vs estimated, year, province coverage, and revisions to the same series. We kept a figure where the evidence supported it, described estimates as estimates, and changed one only where the weight of evidence pointed elsewhere.
Limitations. We publish these because trust is the product.
- Provincial education data in Canada lags one to four years. This report's national trend runs to 2023/24 and 2024/25; some provincial detail is older, and each table states its year.
- Home-education counts are undercounts. Registration rules differ by province and unregistered families are invisible. We report registered counts, and label our estimate of actual practice as an estimate with a range.
- Statistics Canada, Fraser and Cardus count slightly different things (Fraser uses ministry-based counts, Statistics Canada a national survey, Alberta Education counts supervised home education within independent authorities). Where they differ we show why.
- We could not read two of Fraser's PDFs or the Ontario IPC decision directly (access blocked to automated retrieval), so some Fraser and IPC details come from the publishers' own releases and published summaries. Funding rates for Alberta and Quebec rest on several consistent secondary sources and are marked approximate.
- We do not have a consolidated current count of independent schools, a national tuition dataset or a count of unregistered home educators. We would rather say so than invent one. We intend to collect school-published tuition figures for a future edition and will say how.
- The territories are outside the scope of Fraser's provincial data; their pages are limited to Statistics Canada enrolment and the facts we could verify.
- This report is published by a company that builds software for this sector. We have a point of view. Sections 5 and 6 are labelled as analysis and prediction, and the statistics are sourced to third-party data you can check yourself. Where a source's terms restrict reproducing its tables, we cite it and link to it rather than copy it.
Corrections. Found an error, or a better source? Tell us through the corrections form. We publish corrections prominently, with the date, and carry them into the next edition. A report that cannot be corrected cannot be trusted.
Want the data? Request the underlying datasets and chart sources through the report request form.
Questions · 2 min
Frequently Asked Questions
Key takeaways
- Short answers to the questions the data raises most often, with the same sources.
The same questions, with extended answers, are in the FAQ note.
How many independent schools are there in Canada?
The last full national count we could verify is 1,935 (Fraser Institute, 2013/14, ten provinces), with 368,717 students. The sector has grown since: roughly 480,000 students attend independent schools today (about 8.0% to 8.5% of K-12), and Ontario alone has gone from about 950 schools to more than 1,670. The national share reached a new high of 8.0% in 2024/25 (Statistics Canada); independent headcount has dipped only briefly, in 2009/10, 2011/12 and 2020/21.
Which Canadian province has the most homeschoolers?
Alberta, on both measures: about 26,000 registered home-educated students in 2024/25 and the highest rate among the provinces (3.2%). Ontario is second (13,269, 0.6%) and, because it is the largest province, has the most independent and home-educated students combined. Official figures undercount; Cardus has argued the true prairie rate is nearer 6% than the reported 2% to 3%.
Is homeschooling legal in Canada?
Yes, in the provinces we have read, under provincial rules that range from light to structured. Manitoba requires annual notification and two progress reports (currently due January 31 and June 30). Saskatchewan requires notice and a written education plan to a school division, which monitors the program. Quebec requires an annual notice to the ministry (by July 1), a learning project implemented by September 30, and reports through the year. Alberta requires an annual notification to a supervising school authority. We have not read the rules for Prince Edward Island and the territories closely enough to summarize them.
Do Canadian homeschoolers get funding?
It varies. Alberta funds supervised home education ($901 per student in Grades 1-12 in 2025-26). In British Columbia the province pays the registering school ($250 per registered home-schooled child for a public school, $175 for an independent school), not the family. Saskatchewan school divisions set their own grants. Manitoba provides none. We found no home-education funding in Ontario.
What percentage of BC students attend independent schools?
About 13.2% to 13.7% (roughly one in seven), the highest rate in Canada, and nearer 15% if home education is included. British Columbia pays eligible independent schools 50% or 35% of the local public district's per-student operating grant.
Where does this report's data come from?
Statistics Canada tables, Fraser Institute and Cardus research, provincial ministry reports and privacy commissioner investigation reports. Statistics Canada data is open and you can check it yourself; where a publisher's own tables are restricted, we cite and link instead of reproducing. Full methodology in Section 7.
Share it
Quote a statistic
Each line states its definition and carries its citation. Copy it with the source attached.
- Share, not headcount. The independent-school share of Canadian K-12 enrolment rose 45% between 2000/01 and 2023/24, from 5.9% to 8.5%. Public headcount stayed roughly flat (+0.6%). (Fraser Institute, Where Our Students Are Educated, 2026 Edition.)
- A new high. Private and independent schools now enrol 8.0% of Canadian students, a record and the fourth straight rise. (Statistics Canada, The Daily, 4 November 2026.)
- Nearly one in twelve. About 480,000 Canadian students attend independent schools. (Statistics Canada, Table 37-10-0109-01, 2024/25: 479,571; Fraser Institute: 482,939 in 2023/24.)
- Outside the public system. Add registered home education and about 9.5% of Canadian students learn outside government-run schools. (Qentak Research recomputation from Statistics Canada, Table 37-10-0109-01, 2024/25.)
- Doubled in a year. Registered home education in Canada went from 40,608 (2019/20) to 83,988 (2020/21). It was 66,228 in 2024/25. (Statistics Canada, Table 37-10-0109-01.)
- More than tripled. Registered home education rose 264% between 2006/07 and 2021/22, while public enrolment grew 4.5%. (Cardus, Charting New Horizons, 2023, from Statistics Canada.)
- Alberta leads. Alberta reports the most home-educated children, about 26,000 or 3.2% of its students in 2024/25, and the highest rate among the provinces. (Statistics Canada, Table 37-10-0109-01.)
- Counted vs estimated. About 66,000 Canadian children are registered as home-educated. Cardus argues the true prairie rate is nearer 6% than the reported 3%. Our bracket for actual practice: roughly 80,000 to 100,000, an estimate, not a count.
- BC. About 13% to 14% of British Columbia students, roughly one in seven, attend an independent school, the highest share in Canada. (Fraser Institute 2023/24: 13.2%; Cardus 2026: 13.7%.)
- Ontario. Ontario has the most independent students in Canada, about 175,000, and no operating funding. (Statistics Canada, 2024/25.)
- The funding map. Five provinces partially fund independent schools, at roughly 35% to 70% of a public amount on different bases. Ontario and the four Atlantic provinces do not. (Qentak Research, from provincial government sources and Fraser Institute.)
- Manitoba. On October 1, 2025 Manitoba had 71 funded independent schools with 18,012 students and 67 non-funded with 2,592, plus 5,531 home-educated students. (Manitoba Education and Early Childhood Learning, Enrolment Report, October 1, 2025.)
- Manitoba funding. For 2025/26 Manitoba's grant to funded independent schools is based on 50% of public net operating cost per pupil, capped at $6,837 per eligible pupil. (Manitoba Education and Early Childhood Learning, funding guide 2025/26.)
- Same number, two definitions. Alberta's independent share is 4.9% or 6.7% depending on whether supervised home education counted under independent authorities is included. (Statistics Canada; Fraser Institute; Cardus memo, April 2026.)
- Accountability can't be outsourced. Alberta's privacy commissioner made 22 recommendations after the PowerSchool breach and found public bodies remain accountable for their vendor's security. (Alberta OIPC, Investigation Report F2025-IR-02, 17 November 2025.)
- Public spending. Public spending per student in 2022/23 ranged from $13,494 in Alberta to $19,484 in Quebec. (Fraser Institute, Education Spending in Public Schools in Canada, 2025 Edition.)
Keep "share" and "estimate" where they appear: dropping them changes what the number means.